

A Brief History of ELs in the NAEP
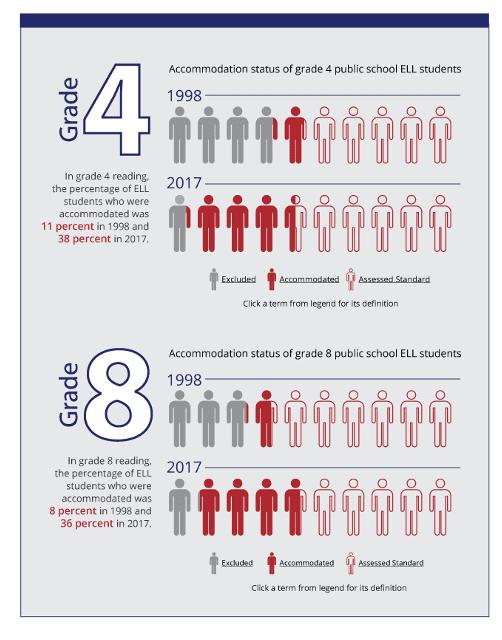

Data for 2019 indicates that in fourth grade, 46% of ELs identified for NAEP testing were assessed with accommodations in math, and 39% in reading, while 8% were excluded from each test. In eighth grade, 38% of ELs identified for NAEP testing were assessed with accommodations in math and similarly in reading, while 13% were excluded from each test.
As public schools and teachers around the nation continue to work hard every day to recover learning time lost due to the pandemic, the NAEP results have been a useful indicator to determine the change in academic achievement between 2019 and 2022 across states and even across districts when combined with state-level assessment data through research methods developed by economists at Stanford and Harvard University. As the participation of ELs in the NAEP increases, their performance on these tests could be more indicative of the actual progress experienced by this group of students.
EL Academic Progress in NAEP
As higher percentages of ELs are not only identified to participate in the NAEP but, more importantly, not excluded from testing, their results will be more representative of the actual state of the academic achievement of ELs across the country. The NAEP reports the assessment results of student performance in two ways: average scale scores on the NAEP subject scale and percentages of students attaining NAEP achievement levels. The NAEP has three achievement levels: basic, proficient, and advanced. For the data displayed in this blog, we used the NAEP achievement level results in reading in Grades 4 and 8 reported for each state in 2019 and 2022. We then calculated the change in the percentage of ELs who scored at or above proficient in reading in each grade between 2019 and 2022.
Looking first at fourth grade reading (Figure 1), the average for the nation went from 9% of ELs scoring at or above proficient in 2019 to 10% in 2022. Nine states had the same percentage of ELs at or above proficient in fourth grade in 2019 and 2022; 23 states had a lower percentage of ELs scoring at or above proficient in 2022 compared to 2019; and 16 states, led by Alabama, experienced a positive change in the percentage of ELs scoring at or above proficient.
Figure 1
Reading Grade 4: Change in Percentage of ELs Scoring at or Above Proficient, 2019 to 2022
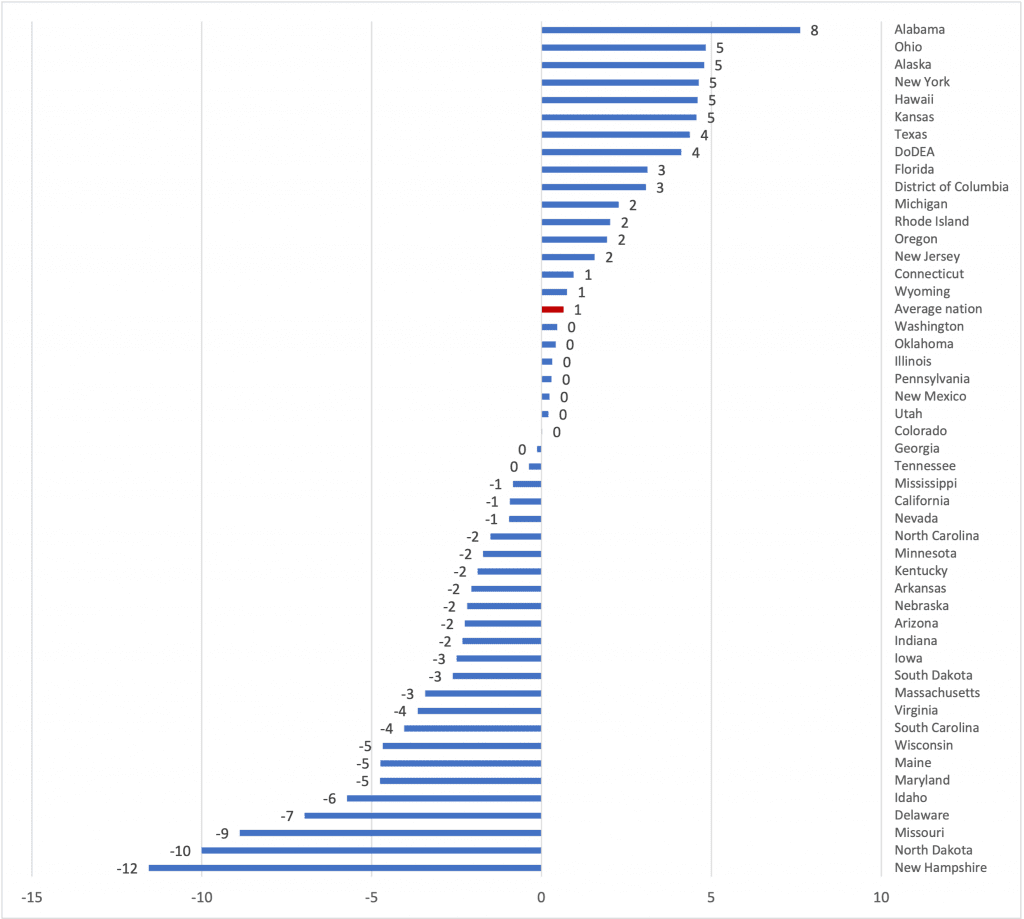

Note. Reporting standards not met: Louisiana, Montana, Vermont, and West Virginia
Source: U.S. Department of Education, Institute of Education Sciences, National Center for Education Statistics, National Assessment of Educational Progress (NAEP), 2019 and 2022 Reading Assessments.
Next, looking at eighth grade reading (Figure 2), the average for the nation went from 3% of ELs scoring at or above proficient in 2019 to 5% in 2022. Three states had the same percentage of ELs at or above proficient in eighth grade in 2019 and 2022; 17 states had a lower percentage of ELs scoring at or above proficient in 2022 compared to 2019; and 17 states, led by Texas, experienced a positive change in the percentage of ELs scoring at or above proficient. ELs in Alaska, Hawaii, Texas, and Oregon experienced a positive change in both grades.
Figure 2
Reading Grade 8: Change in Percentage of ELs Scoring at or Above Proficient, 2019 to 2022
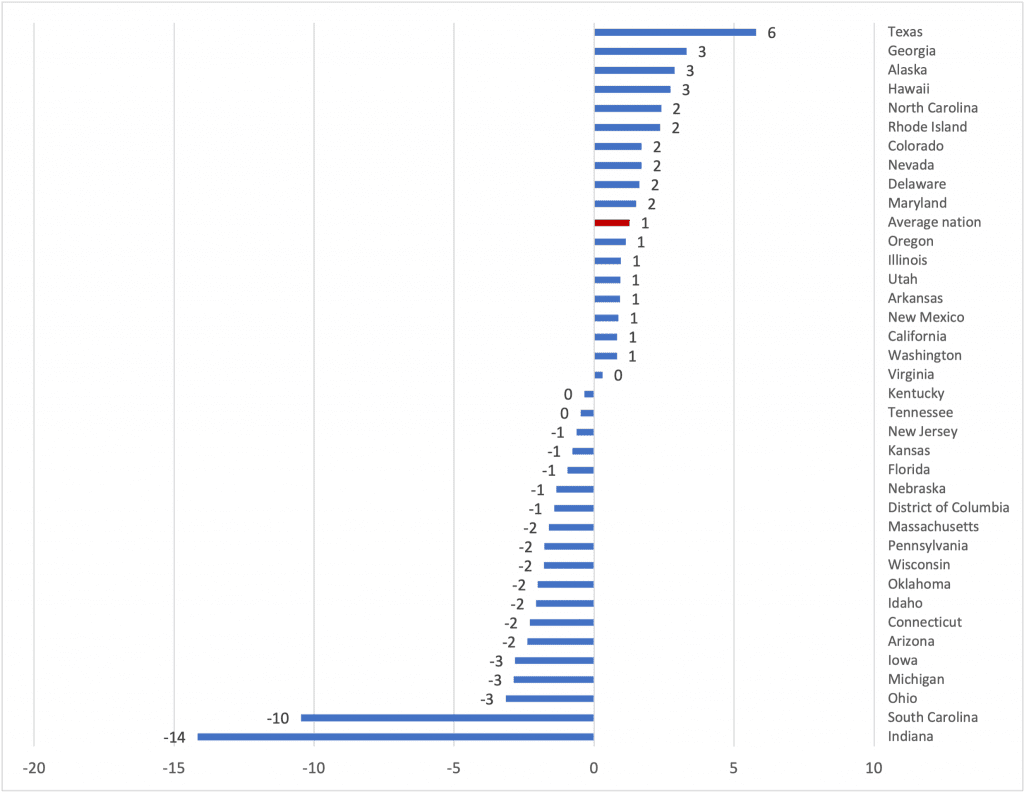

Note. Alabama, Louisiana, Maine, Mississippi, Missouri, Montana, New Hampshire, North Dakota, South Dakota, Vermont, West Virginia, and Wyoming: Reporting standards not met.
Source: U.S. Department of Education, Institute of Education Sciences, National Center for Education Statistics, National Assessment of Educational Progress (NAEP), 2019 and 2022 Reading Assessments.
Supporting the Academic Progress of ELs
To build on these positive results, educators need to focus on the vital role that evidence-based support for ELs plays in their academic achievement. Be sure to check out our other blog discussing the implementation of instructional practices to bolster EL achievement and a recent blog from REL Southeast focused on implementing evidence-based practices for ELs in Alabama. At Gulf CC, we will continue to connect you to evidence-based resources to support the academic progress of ELs. Check our website and social media pages often!
Author: Verónica Ruiz de Castilla, PhD, Region 7 Comprehensive Center
Kimilee Norman-Goins (Ed.)
References
U.S. Department of Education, Institute of Education Sciences, National Center for Education Statistics, National Assessment of Educational Progress (NAEP) (1992, 1994, and 1998). Reading Assessments; 1992 and 1996 Mathematics Assessments. Tables R_TableA-14 and M_TableA-14. https://nces.ed.gov/nationsreportcard/about/inclusion.aspx#exclusion_rates
U.S. Department of Education, Institute of Education Sciences, National Center for Education Statistics, National Assessment of Educational Progress (NAEP). (1998–2019). Reading Assessments, Tables A-26 and A-28. https://nces.ed.gov/nationsreportcard/about/inclusion.aspx#exclusion_rates
U.S. Department of Education, Institute of Education Sciences, National Center for Education Statistics, National Assessment of Educational Progress (NAEP). (2000–19). Mathematics Assessments, Tables A-26 and A-28. https://nces.ed.gov/nationsreportcard/about/inclusion.aspx#exclusion_rates
U.S. Department of Education, Institute of Education Sciences, National Center for Education Statistics, National Assessment of Educational Progress (NAEP). (2017) Comparing ELL accommodations on NAEP. https://www.nationsreportcard.gov/focus_on_naep/student_groups/#/english-learners